3 Results
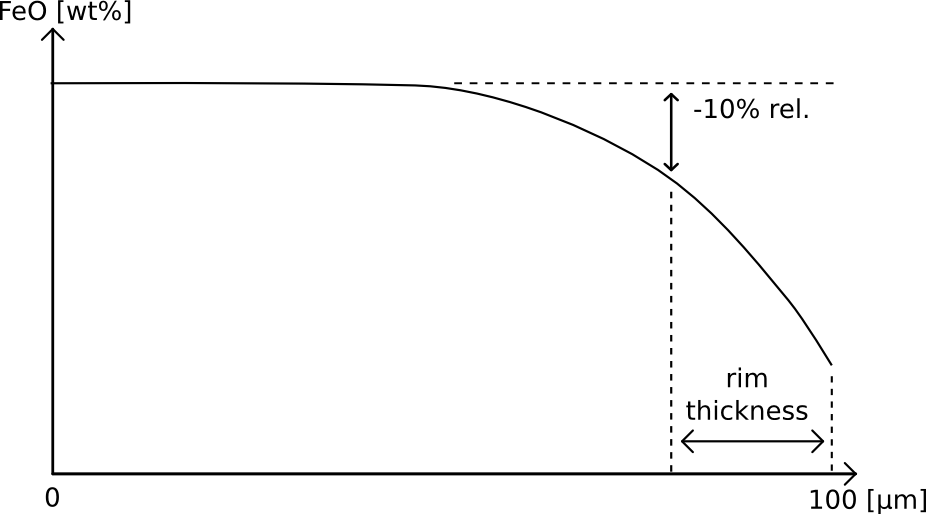
For each experiment four olivine crystals were analyzed with seven EPMA points per crystal resulting in a total of 300 datapoints. The reduction rim width is defined as the distance from the grain boundary to the area where the difference between the FeO-core average and a data point is greater than 10% (see
Figure 4).
3.1 Sample C14 (18 hours heating)
The sample C14 has been heated for 18 hours at a temperature of 1250°C and an oxygen fugacity of IW-4.
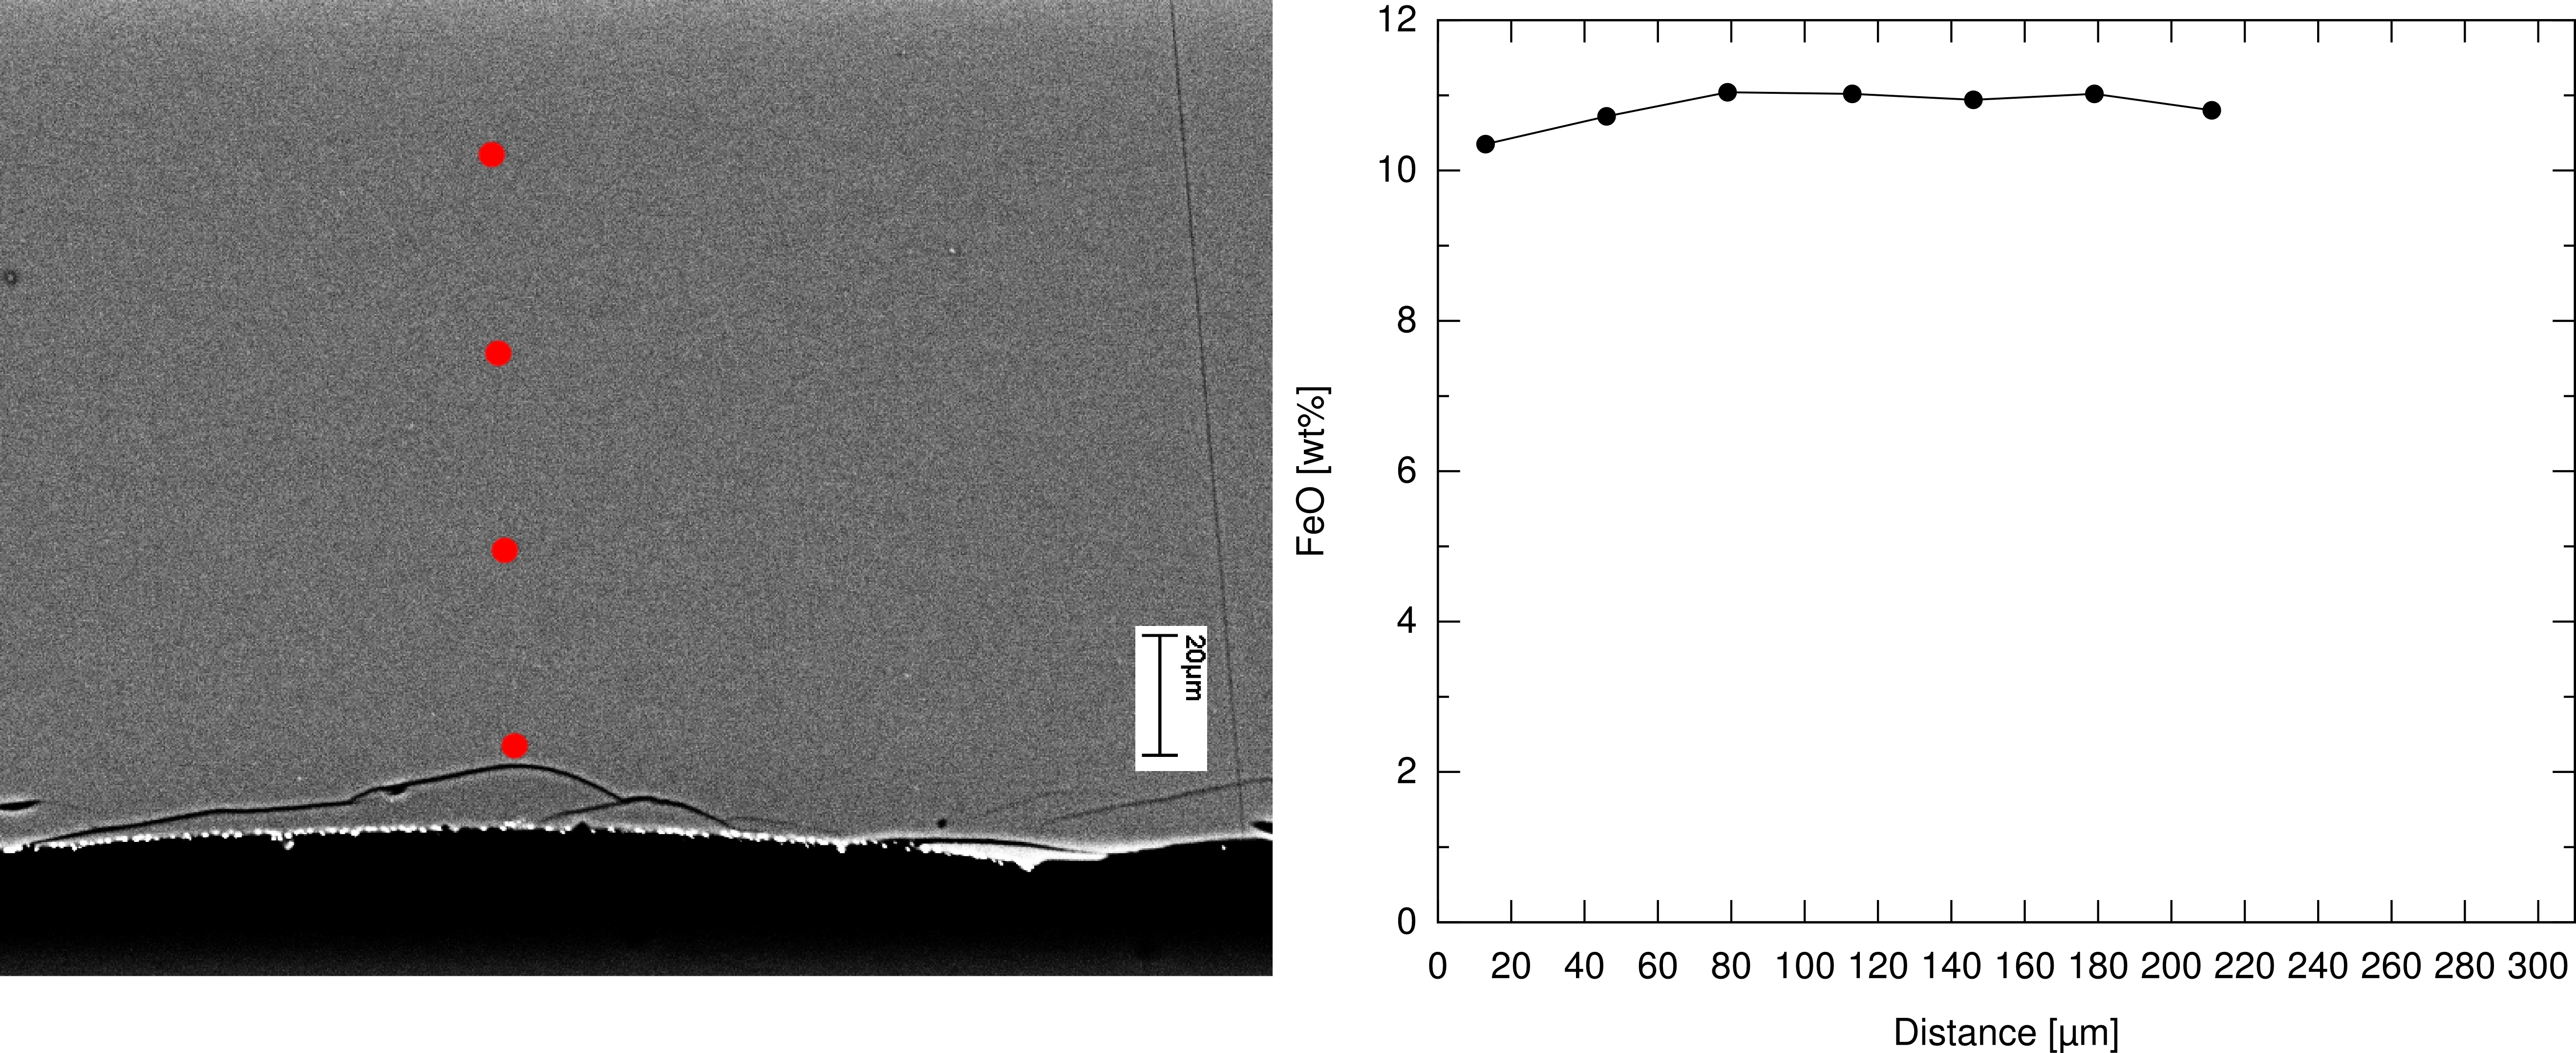
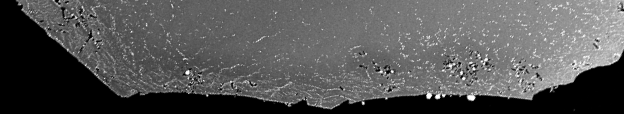
Figure 5 shows a BSE image of this experiment. The core and mantle regions appear to be a homogenous area with no contrast differences. This suggests that the core and mantle regions in the crystals are unaltered. At the rim region, however, a very narrow reduction rim with bright, exsolved iron metal blebs is observeable. These blebs are limited to the grain surface and form a reduction rim of ~1µm width. The diameter of the blebs is <1µm.
The diagramm in
Figure 5 illustrates the FeO content in this crystal. The x-axis starts at 0 (rim) and shows the distance from the rim in µm. The y-axis shows the FeO-content in wt%. The curve in this diagram shows no differences in respect of FeO-content between the core and the rim. Thus, in this experiment the average rim width ranges between 0-1µm and is limited to the grain surface only.
3.2 Sample C15 (24 hours heating)
The experiment C15 has been heated for 24 hours at a temperature of 1250°C and an oxygen fugacity of IW-4.
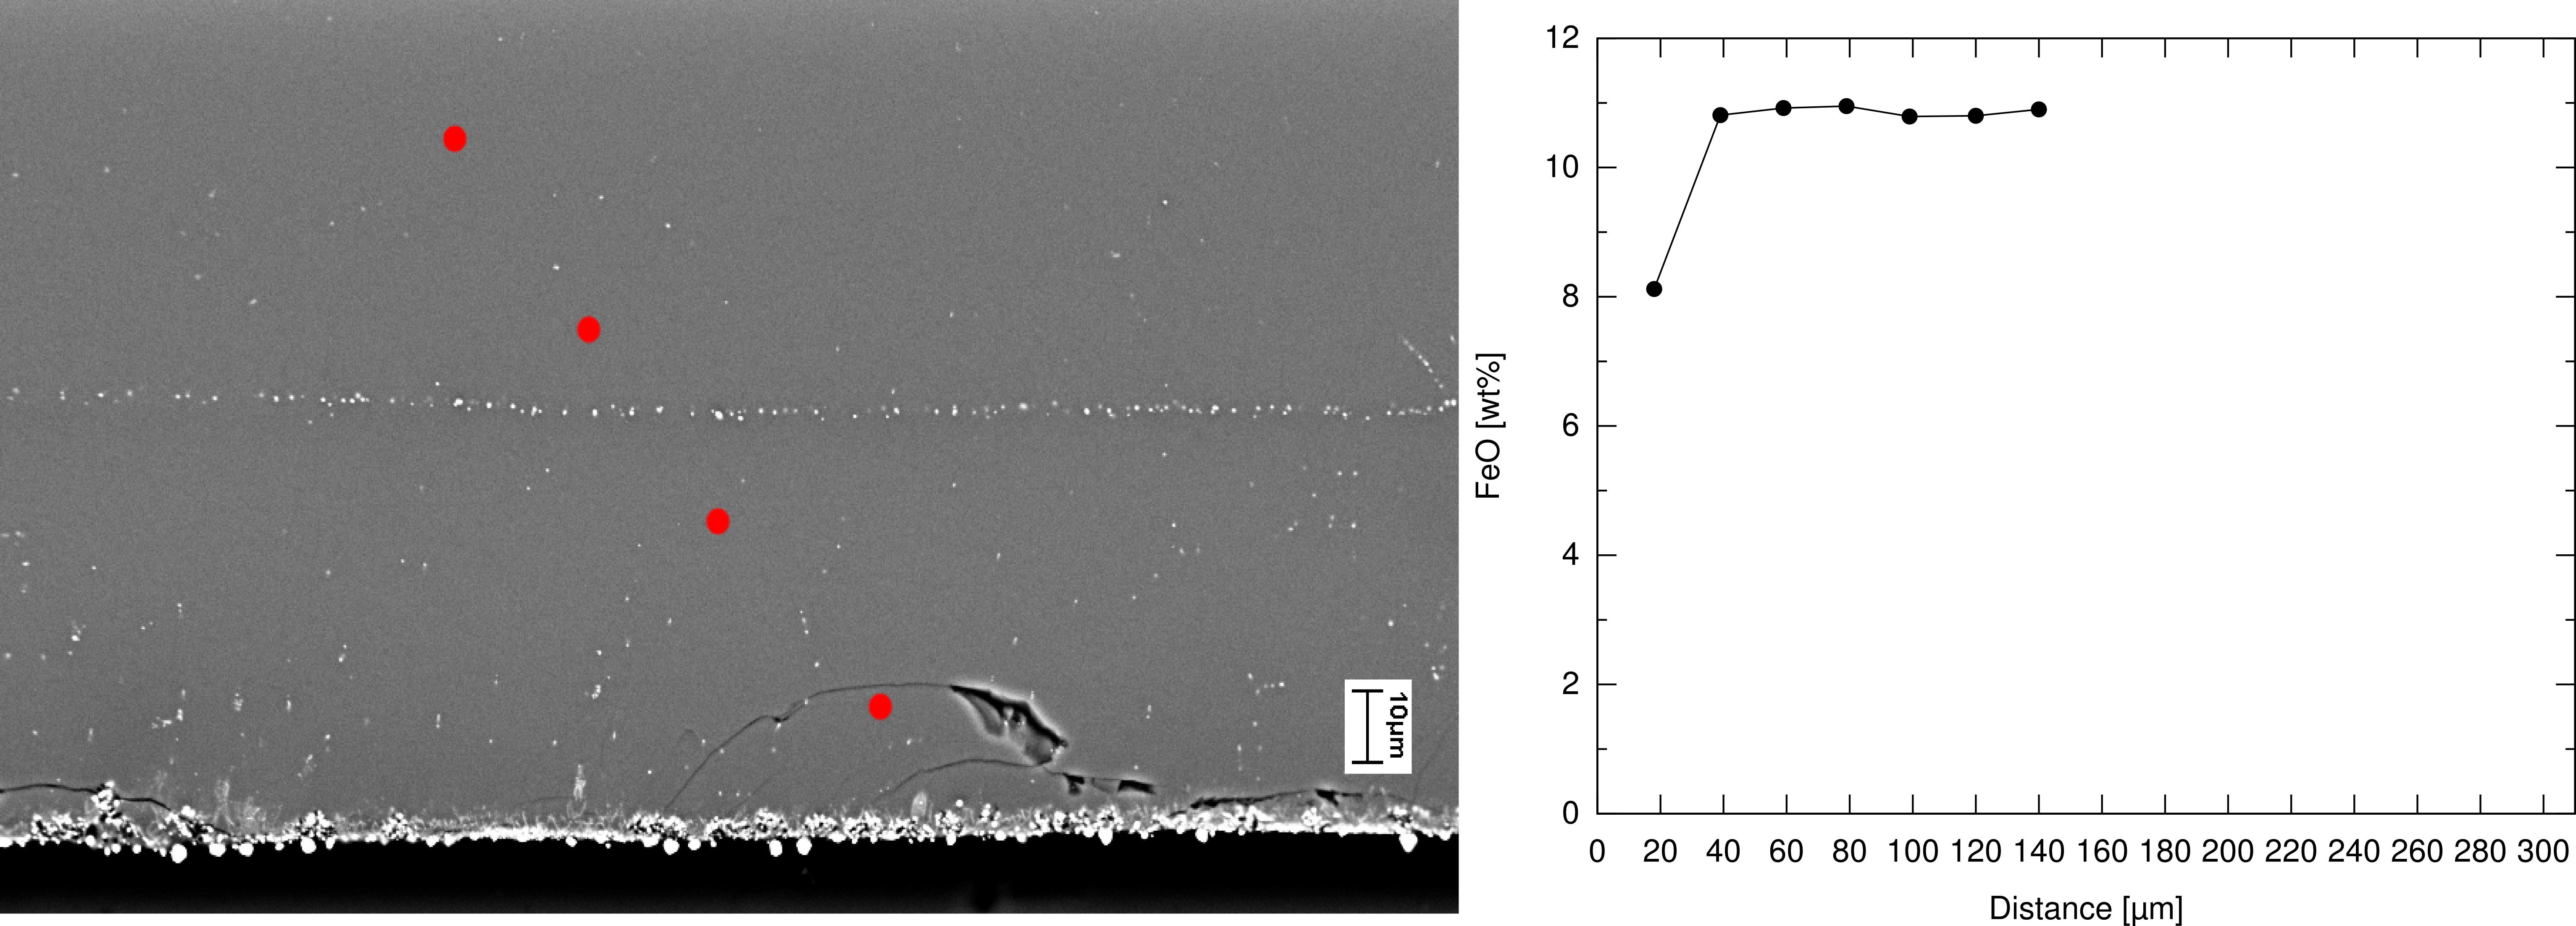
Figure 6 shows a BSE image of this experiment. The core and mantle regions of the crystals in this experiment are characterized by scattered iron blebs. At the rim regions, however, the density in iron blebs increased along with their diameter to ~1µm. The width of this zone at the grain surface is about 1-2µm.
The diagramm in
Figure 6 illustrates the FeO content in wt% as a function of distance from the rim measured in µm. The first data point with a distance of ~20µm from the grain surface shows a FeO value of 8.12 wt% while the FeO value in the core is 10.90 wt%. The decrease in FeO-wt% is due to the
reduction of Fe-2+ to metallic iron and iron blebs. The average reduction rim width in this experiment is 10.17 µm.
3.3 Sample C16 (48 hours heating)
The experiment C16 has been heated for 48 hours at a temperature of 1250°C and an oxygen fugacity of IW-4.
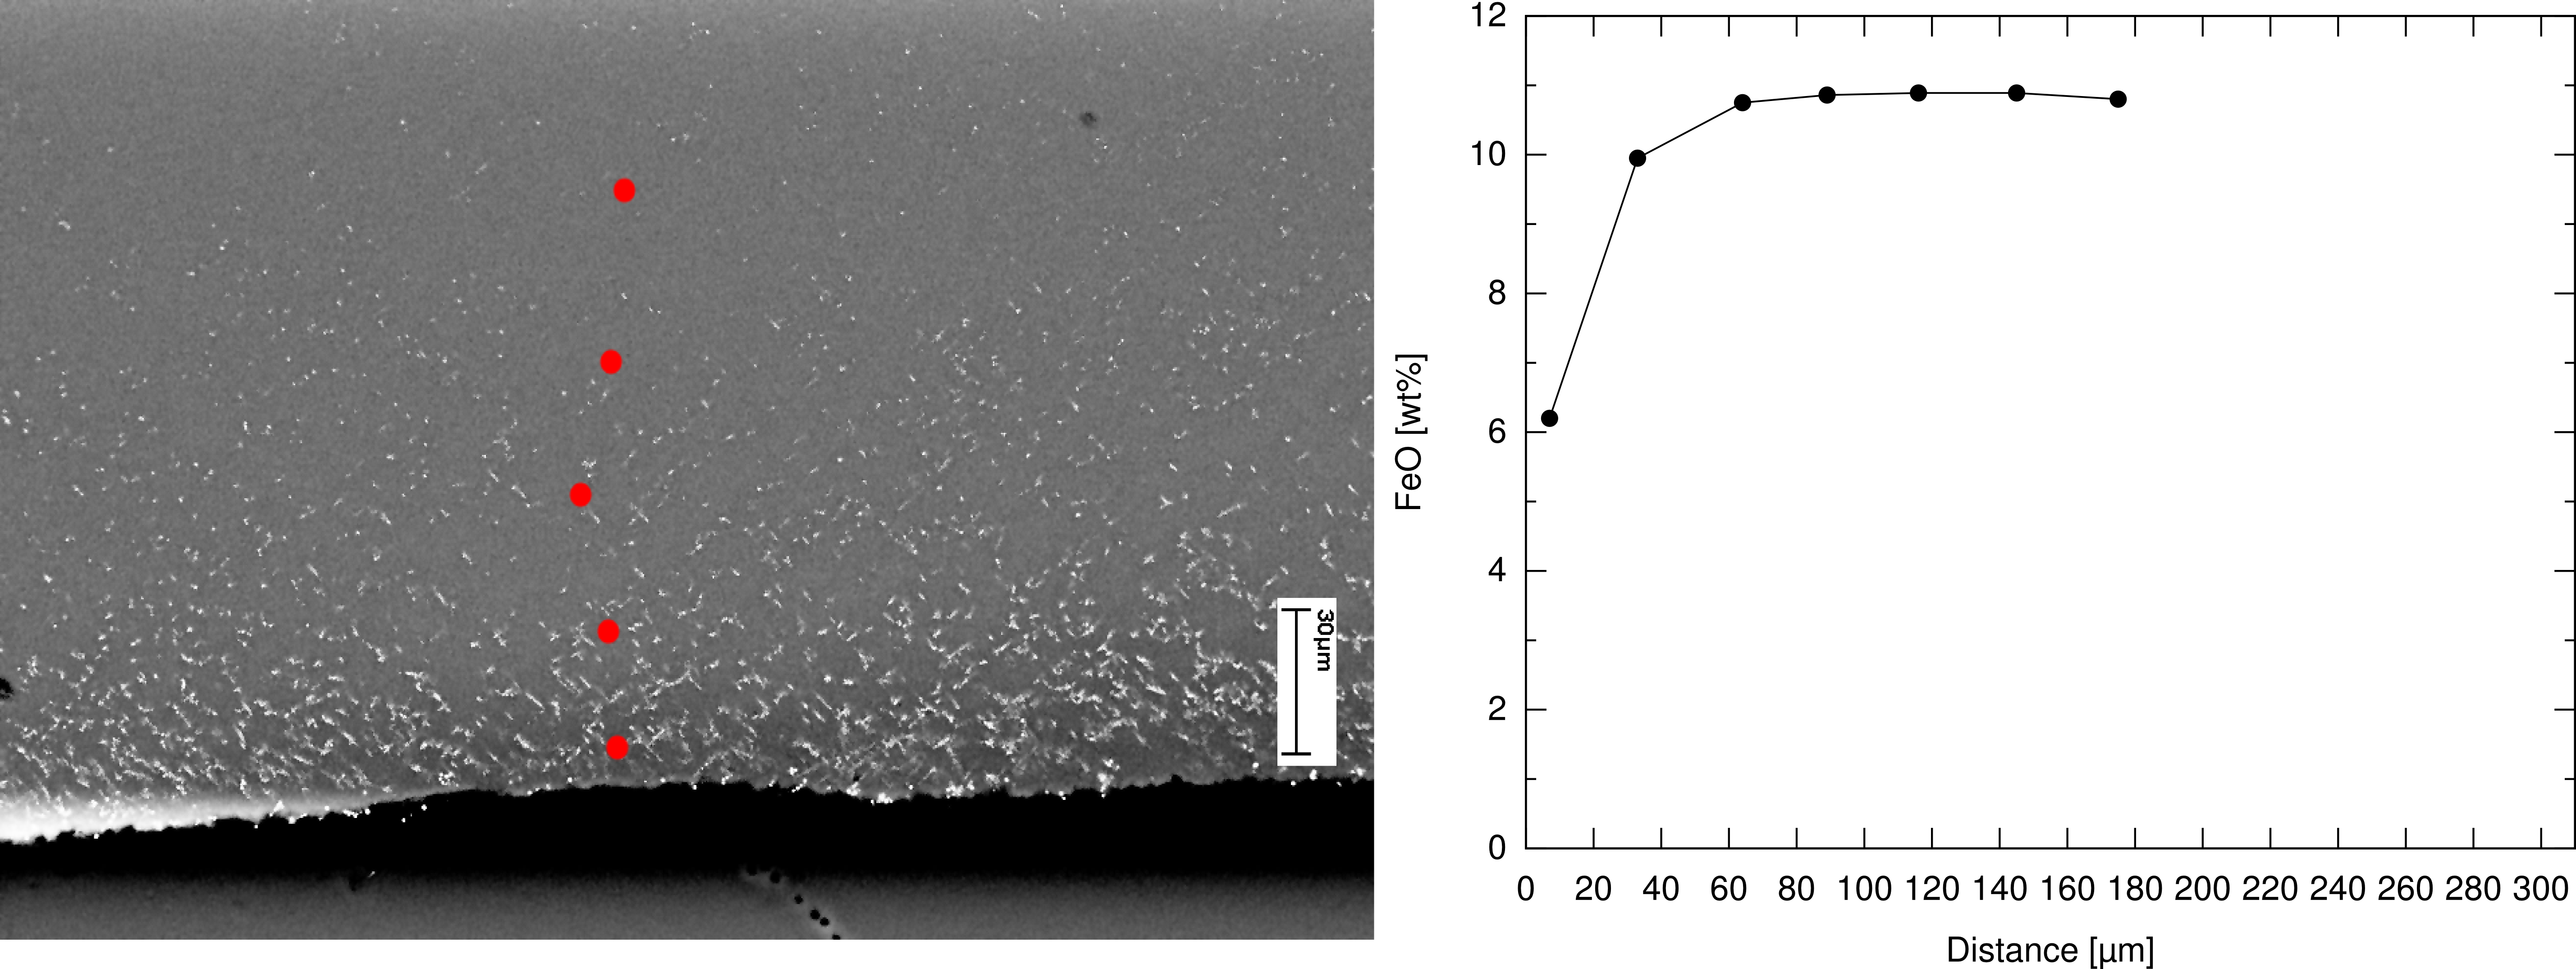
Figure 7 shows a BSE image of this experiment. The frequency of iron metal blebs in the core and mantle regions increased compared to the previous experiments C14 and C15. In the rim regions the blebs are no longer limited to the grain surface but form a zone in which the iron metal blebs are highly concentrated. The width of this zone is 25-30µm.
The diagramm in
Figure 7 illustrates the FeO content in wt% as a function of distance from the grain boundary measured in µm. The distance of the first data point from the grain boundary is between 5 and 10µm. The FeO-wt% at this point is 6.20 wt%. The increase in iron metal blebs lead to a decrease in the FeO-content which is expressed by this low value. The average reduction rim width in this experiment is 27.29 µm.
3.4 Sample C17 (72 hours heating)
The experiment C17 has been heated for 72 hours at a temperature of 1250°C and an oxygen fugacity of IW-4.
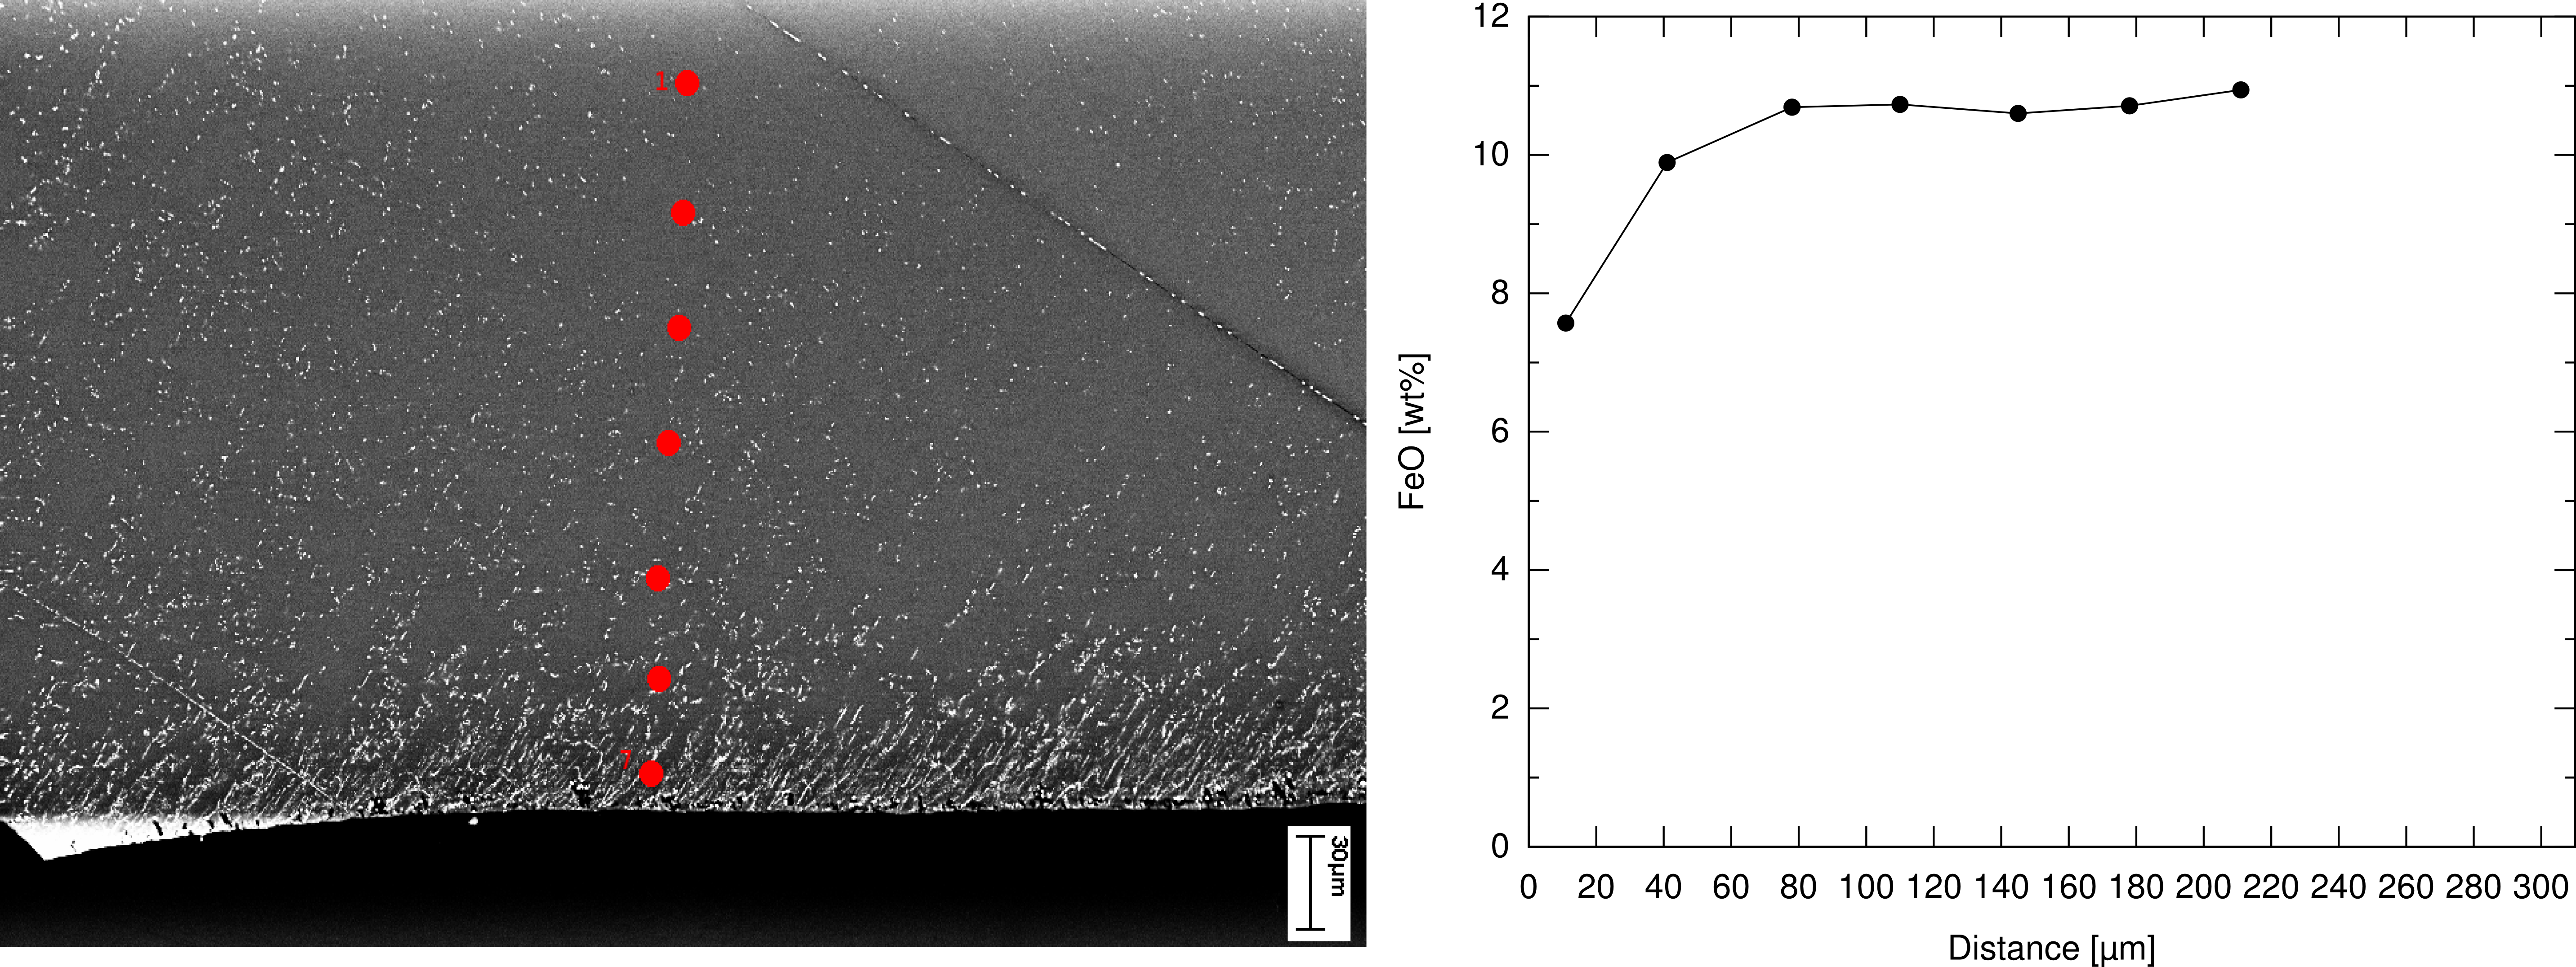
Figure 8 shows a BSE image of this experiment. The iron metal blebs in the core and rim regions are very frequent. The iron metal blebs in the rim region form trails reaching from the grain surface to the mantle region. The olivine matrix in the rim region is characterized by a darker color suggesting a more forsteritic composition.
The diagramm in
Figure 8 illustrates the FeO content in wt% as a function of distance from the grain boundary measured in µm. The distance of the fist data point from the grain boundary is 10µm. The FeO-wt% at this point is ~7.5wt%, the core composition is 10.64 wt% FeO. The average rim width is 33µm.
3.5 Sample C18 (144 hours heating)
The experiment C18 has been heated for 144 hours at a temperature of 1250°C and an oxygen fugacity of IW-4.
Figure 9 shows a BSE image of this experiment. The frequency of iron metal blebs in the core and mantle regions reached a level similar to that in the rim regions. The crystals show an almost homogenous distribution of iron metal blebs. This distribution prevents from distinguishing optically between the reduction rim and the core or mantle region. A dark halo (dark colored olivine matrix) around a fracture at the lower right part of the image shows a reduction rim depleted in FeO due to the formation of metallic iron blebs in the fracture.
The diagramm in
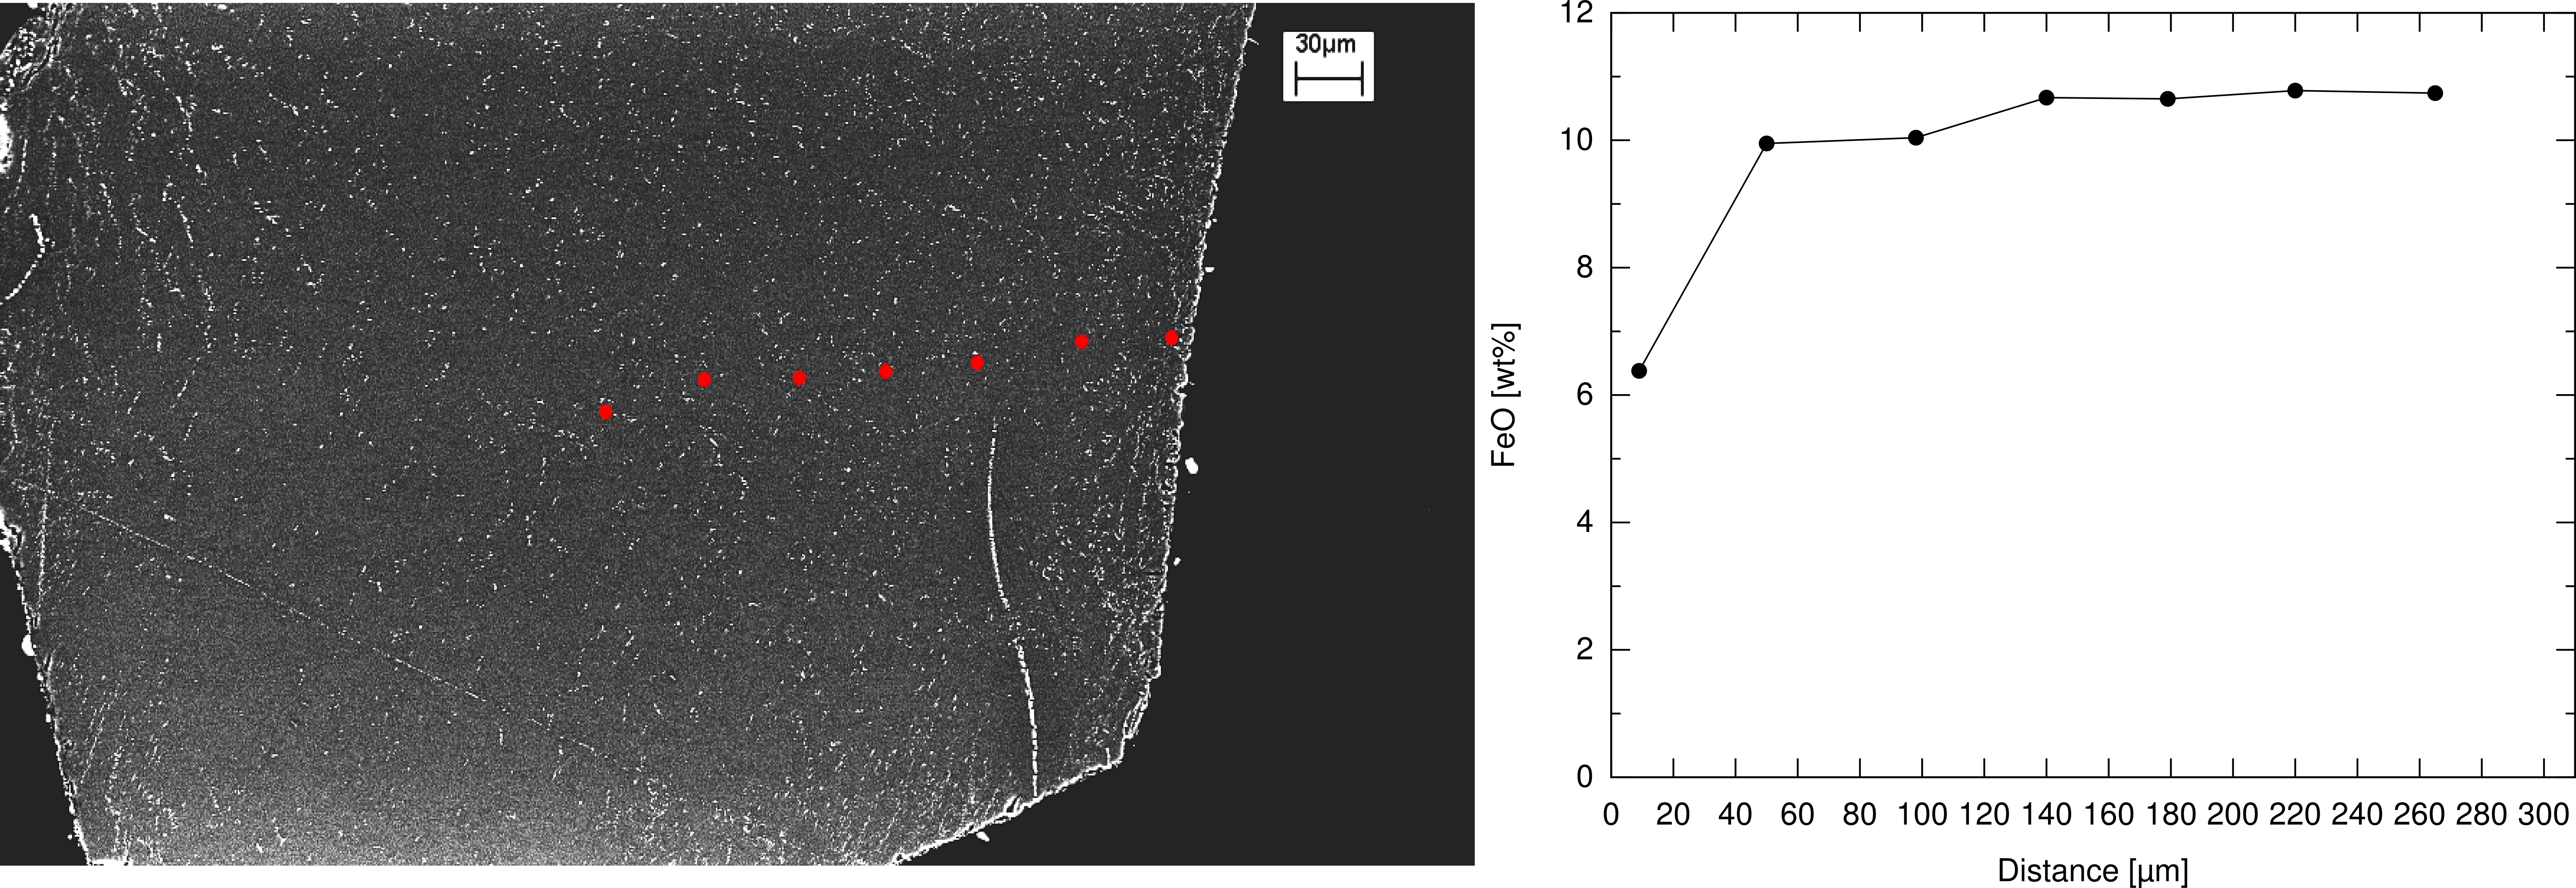
Figure 9 illustrates the FeO content in wt% as a function of distance from the grain surface measured in µm. The distance of the first data point from the grain surface is 10µm. The FeO composition at this point is 6.38 wt%, the core composition is 10.52 wt% FeO. The average rim width is 37.20 µm.
3.6 Sample C19 (204 hours heating)
The experiment C19 has been heated for 204 hours at a temperature of 1250°C and an oxygen fugacity of IW-4.
Figure 10 shows a BSE image if this experiment. The core and mantle regions show a homogenous high distribution of iron metal blebs. The grain surface is characterized by small holes (2-4µm) probably associated with the reduction process. The iron metal blebs in the rim region form long, round trails reaching from the holes at the grain boundary to the outer mantle region of the crystals. The olivine matrix at these trails is of darker color and has a width of ~15-20µm.
The diagramm
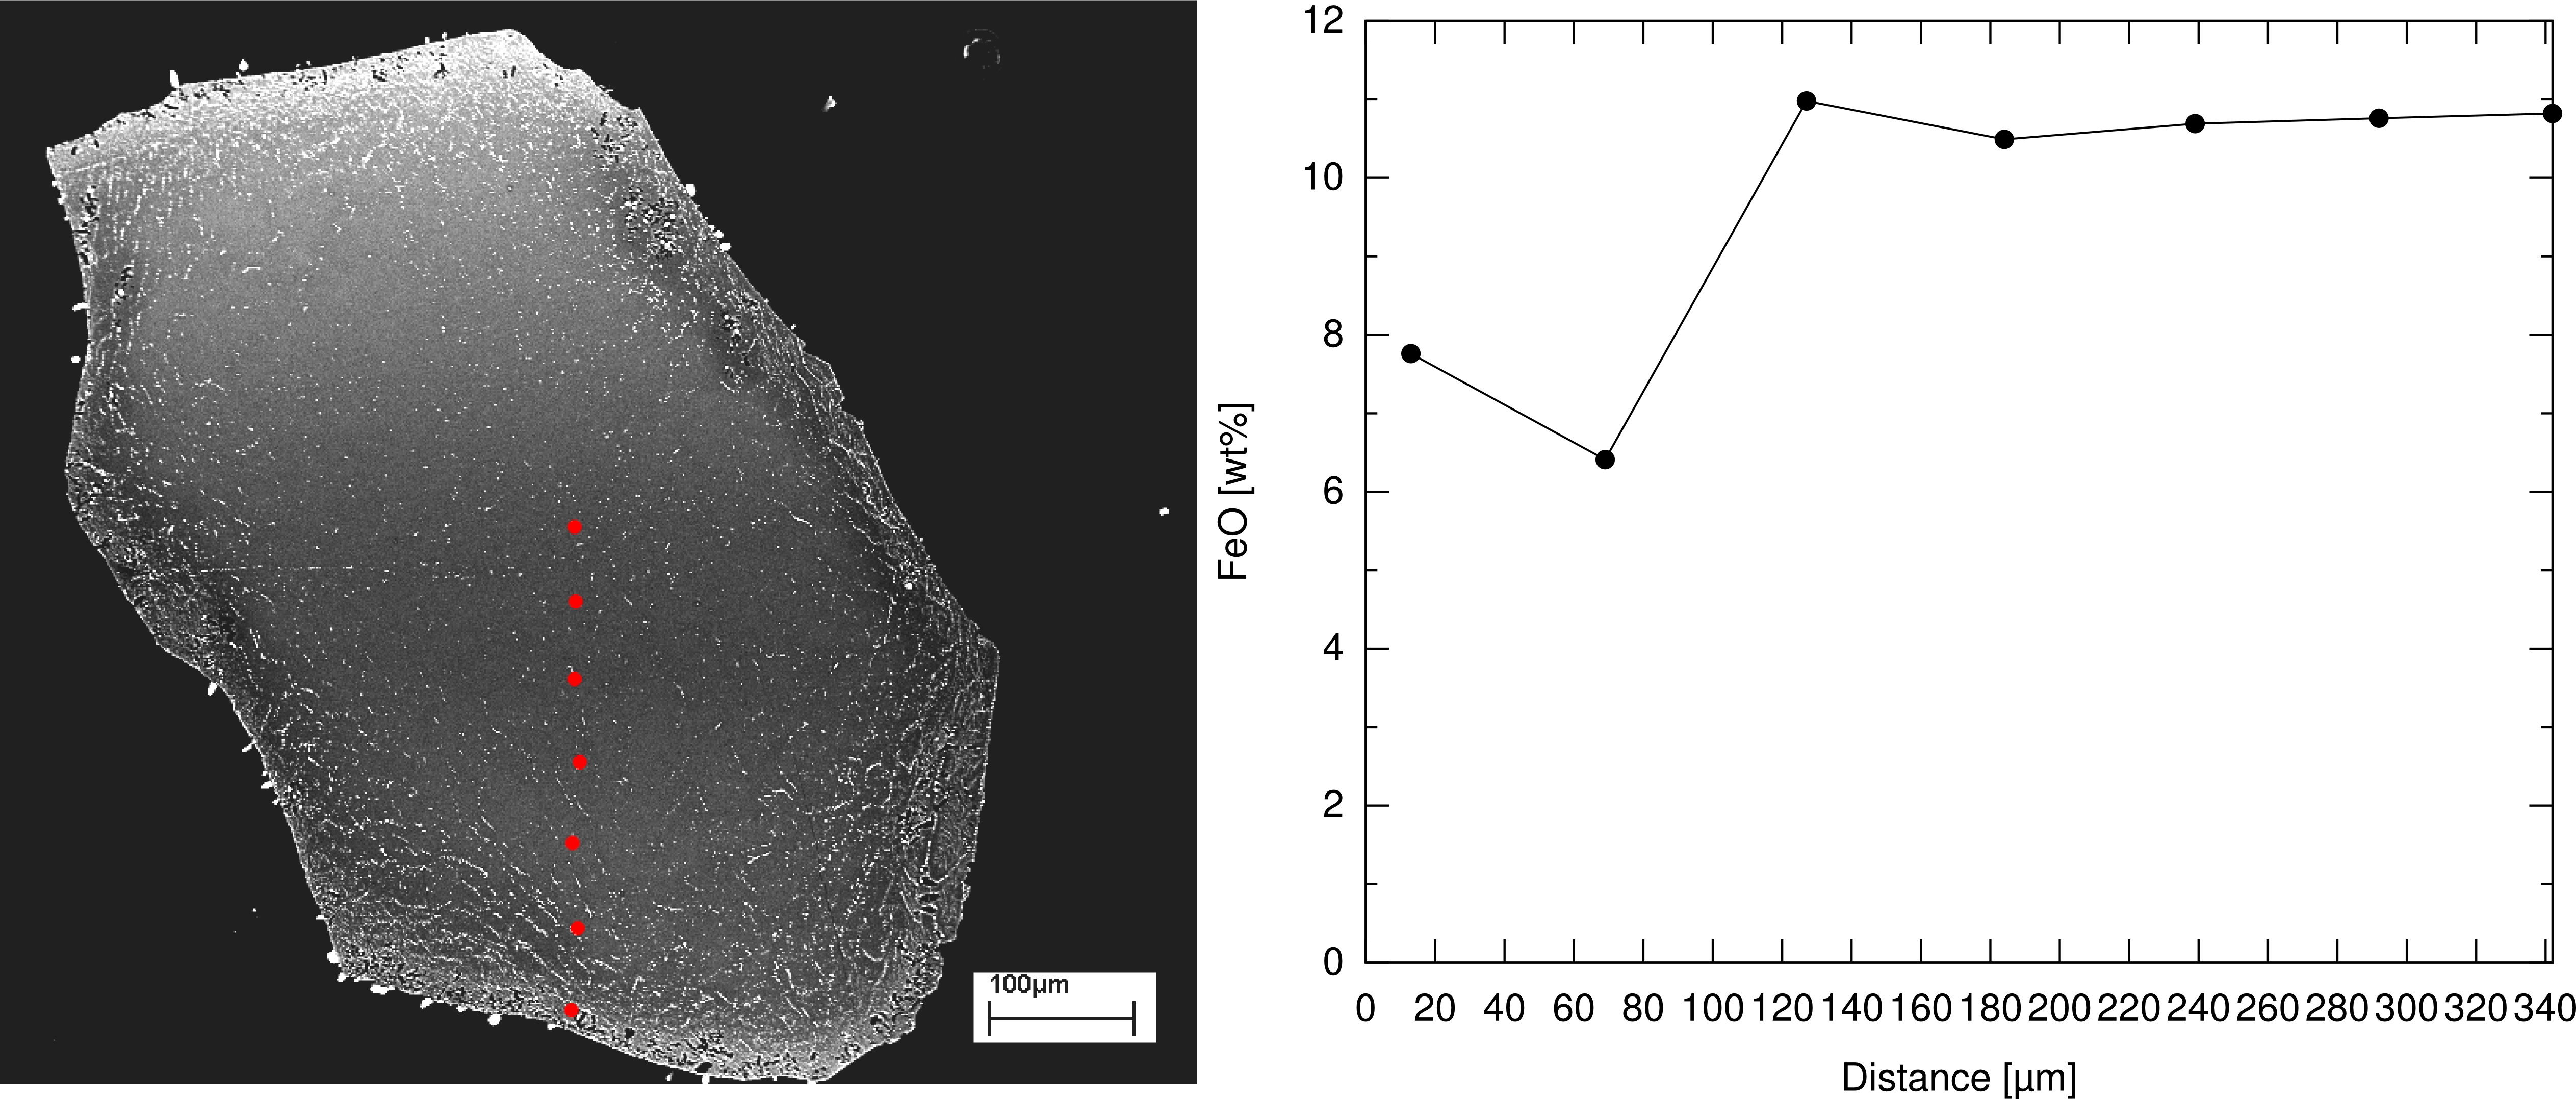
Figure 10 illustrates the FeO composition in wt% as a function of distance from the grain surface measured in µm. The distance from the first data point to the grain boundary is 10-15µm. The FeO composition at this point is 7.76 wt% while the second data point shows a value of 6.41 wt%. This increase at the last data point in the rim region shows the high density in iron metal blebs close to the grain boundary. Analyses done in this region are dominated by the internal microprobe conversion of metallic iron to Fe-2+ leading to an increase in FeO. The core composition in this experiment is 10.82 wt% FeO. The average rim width is 78.83 µm.
Rim width as a function of time
In
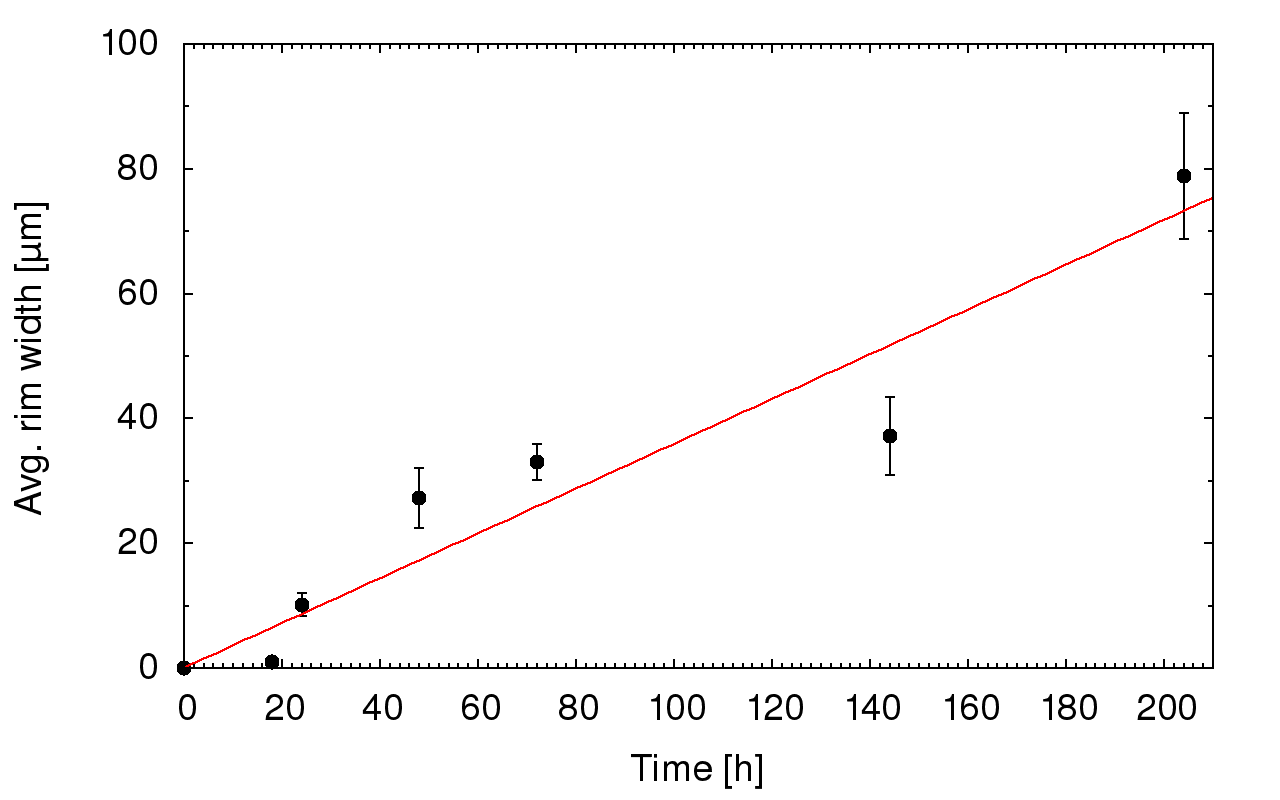
Figure 11 the average reduction rim width of each experiment is plotted as a function of time. The red line is the line of best fit with an intercept set to 0. The time range of the conducted experiments is between 18 and 204 hours resulting in a rim width between ~1 and ~79 µm, respectively. The slope of the red line is a measure for the increase in rim width per hour which is 0.36 +/- 0.03 µm/h at a temperature of 1250°C.
 Reduction rims in San Carlos olivines: an analog to reduction rims in ureilite olivines -- GeoPeP 2013