2 Experimental procedures and analytical methods
The methods used in the experiments are divided in two parts:
(1) sample preparation including heating in an reducing atmosphere within a furnace at a constant temperature and gas flow;
(2) analyzing and measuring of the reduction rim widths using a SEM (
scanning
electron
microscope) and electron microprobe. An overview of specific sample setups is listed in
Table 1.
Table 1. Experiment conditions
|
Sample
|
T [°C]
|
t [h]
|
|
|
C14
|
1250
|
18
|
IW-4
|
|
C15
|
1250
|
24
|
IW-4
|
|
C16
|
1250
|
48
|
IW-4
|
|
C17
|
1250
|
72
|
IW-4
|
|
C18
|
1250
|
144
|
IW-4
|
|
C19
|
1250
|
204
|
IW-4
|
2.1 Experimental procedures: Heating and reduction
The starting material with a grain size between 250µm and 300µm was placed in a ceramic crucible on a thin layer of graphite. The crucible was held by a Fe-wire loop and connected to a ceramic rod which was moved into the furnace. The temperature inside of the furnace was fixed at 1250°C which is thought to be the temperature of the pigeonite euctetoid reaction line suggested by Takeda et al. (1986) and lies within in the temperature range for ureilite formation suggested by Singletary & Grove (2003).
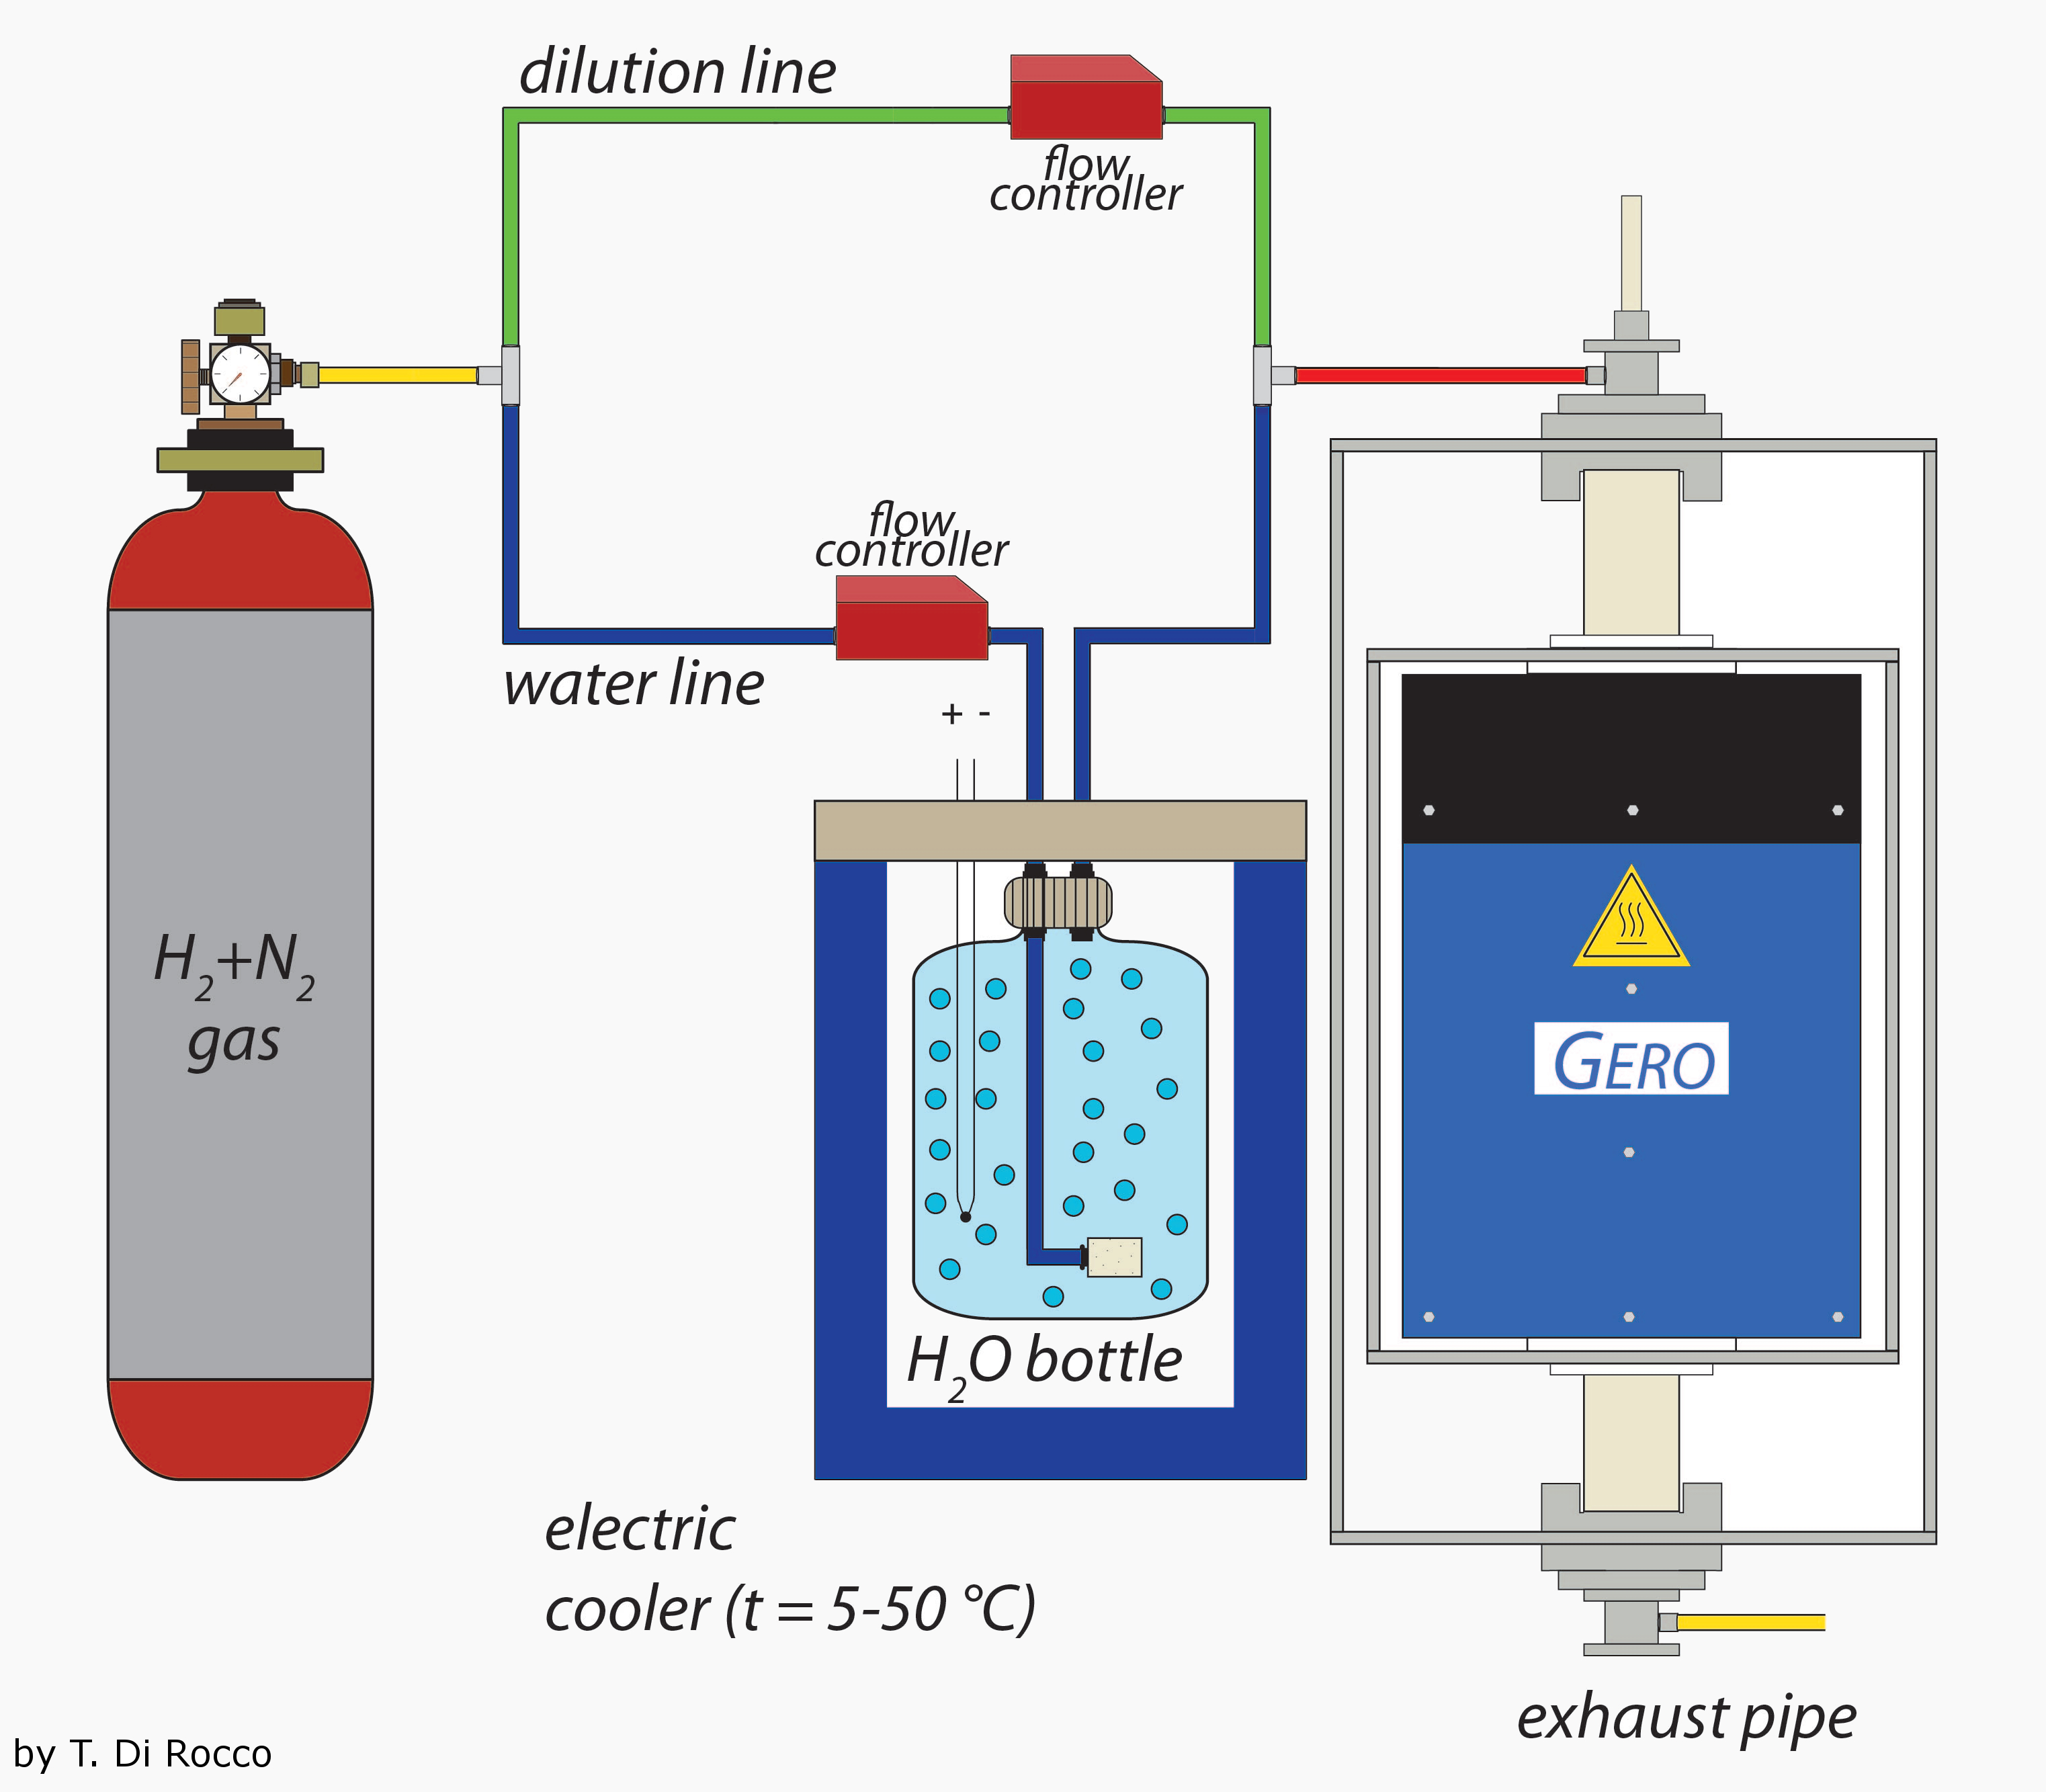
In the second step the furnace was flushed with a gas mixture of H
2 + N
2 and H
2O (g). The two gases are lead through two different lines. Through the first line (direct line) runs a gas flow of H
2 with N
2 as carrier gas (ratio 1:10). The second line (water line) carries the H
2 + N
2 into a water tank at a temperature of 15°C. The H
2 + N
2 gas mixture was thusly saturated with water vapor. The amount of water vapor in the H
2/N
2 gas mixture is controlled by the gas volume lead into the water and the water's temperature. The volume ratio of both the direct and the water line controls the oxygen fugacity inside of the furnace which, in these experiments, was fixed at IW-4. A general experimental setup is illustrated in
Figure 3.
2.2 Analytical methods: Chemical analyses and determination of rim widths
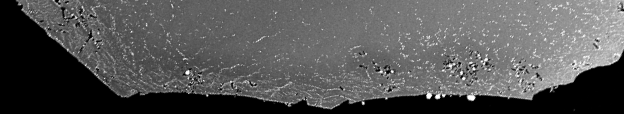
A total of six experiments were analyzed using a SEM with a BSE (back scattered electrons) detector. Pictures created by this method are in gray-scale. Sample areas with high atomic number Z (such as iron) are thus displayed with high contrast (e.g. white) while areas with relatively low Z are displayed with dark gray colors or lower contrast (Lloyd, 1987). This allows to distinguish between different phases within one olivine crystal and thus to observe the formation and distribution of metallic iron blebs (white).
In order to quantify the rim widths we ran chemical core to rim profiles of FeO, MgO, SiO, and NiO with an electron mircoprobe. This data was then connected to the length of a given profile so that every data point holds two information: the (1) chemical composition at a specific (2) distance from the grain boundary of a given crystal.
 Reduction rims in San Carlos olivines: an analog to reduction rims in ureilite olivines -- GeoPeP 2013